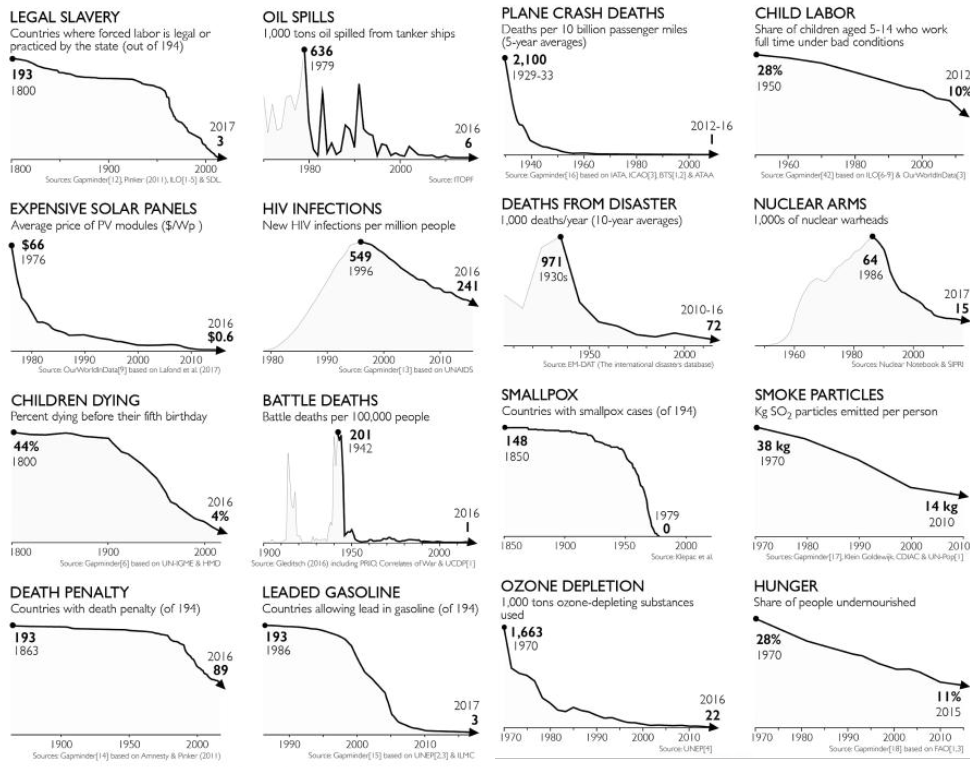
I’m not saying the numbers don’t count. I’m saying they’re both trivial and misleading. In 1929 51 people died in aircrashes. In 1979 271 people died in a single crash. 1929 is a huge spike on the graph. 1979 isn’t even a blip. It’s a badly constructed graph. You’d get points off for this if presented as the answer to a question in a stats class. Also, is it showing, I assume (since we don’t have access to data on how the graph was constructed) the data for America, but in other graphs it shows global stats. Why did the author pick America and not global? Were the data not available for other countries? Did the data not tell the story the author wished for? We can’t tell. Why is this graph a 5-year average- none of the other graphs are. Does it tend to hide irregularities that would bias the reader against conclusions the author wished the audience to reach, or is there a totally benign, reasonable explanation I’m not thinking of? We don’t have access to the data they used. We can’t tell.
Am I a cynic? Yeah, I suppose when I find hopium goes down bitter, yes I am. It’s not a matter of “everything needs to be perfect or it doesn’t count” or somesuch, as another commenter suggested, but rather a matter of “this is totally irrelevant in the face of a looming apocalypse.” Where are our regulations for the climate? Where is our “airplane construction”, our “pilot training”? It’s a case of “Don’t look at the bad numbers, look at these happy numbers instead!” Gag me with a fucking spoon, and then let’s pass some fucking legislation or burn something important until people are willing to listen.
Again, not saying the numbers are false, but trivial, misleading, and irregular. The picture it paints is a deepity.