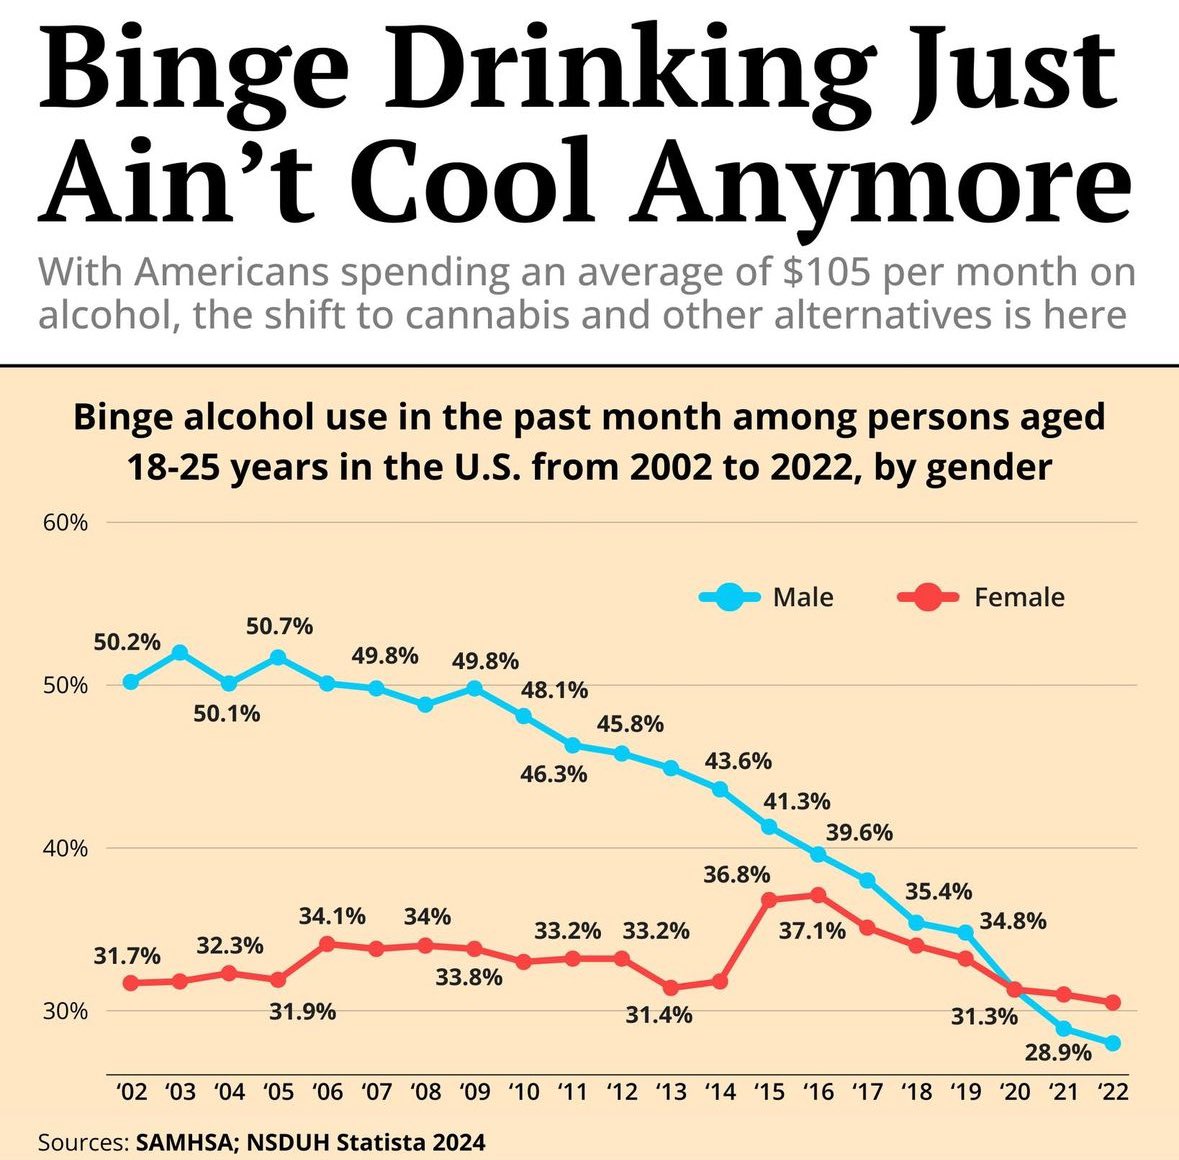
the graph covers 20 years. i think what we’re seeing is the 35+ y.o. people gradually cutting back because the doctor’s telling them to stop beating the shit out of their liver, in addition to younger generations not picking up the “let’s get shitfaced every weekend” habit
i think what we’re seeing is the 35+ y.o. people gradually cutting back because the doctor’s telling them to stop beating the shit out of their liver
No, that’s not how the graph works. It isn’t following one generational cohort as they age; it’s measuring the behavior of a certain age group and switching to new people as they age out.
It’s only measuring the second part of what you wrote.

the graph covers 20 years. i think what we’re seeing is the 35+ y.o. people gradually cutting back because the doctor’s telling them to stop beating the shit out of their liver, in addition to younger generations not picking up the “let’s get shitfaced every weekend” habitedit : I guess I should learn to read
Naltrexone helps for anyone already seeing the doctor to curb the drinking urges.
Getting prescribed ER Adderall has done wonders for my other addictions lol.
No, that’s not how the graph works. It isn’t following one generational cohort as they age; it’s measuring the behavior of a certain age group and switching to new people as they age out.
It’s only measuring the second part of what you wrote.