- 7 Posts
- 7 Comments


 42·2 months ago
As always, relevant Wikipedia links:
https://en.m.wikipedia.org/wiki/Al-Khwarizmi https://en.m.wikipedia.org/wiki/Donald_Knuth https://en.m.wikipedia.org/wiki/Algorithm
You should upload this as a post!
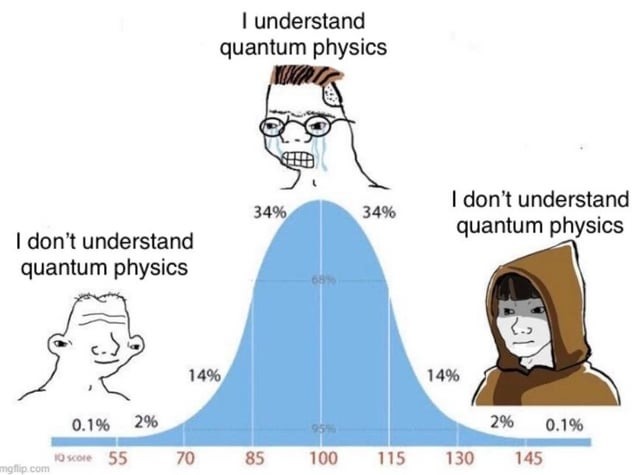
Yeah maybe shift the X scale by 40 IQ points and it would be more accurate.
The x axis is position. The y axis is energy. The blue box is a potential energy barrier. The red curve shows the wavefunction of a particle at a certain energy level coming in and tunneling through the wall. (the wavefunction actually live on a different y-scale from this plot and is only superimposed here for illustrative purpose, so don’t use the energy y-scale to read into the amplitude of the oscillatory part).
more info: https://en.m.wikipedia.org/wiki/Quantum_tunnelling
Phonon Spectroscopy