

- cross-posted to:
- dataisbeautiful@lemmy.world
- cross-posted to:
- dataisbeautiful@lemmy.world
cross-posted from: https://feddit.org/post/3142575
You must log in or # to comment.
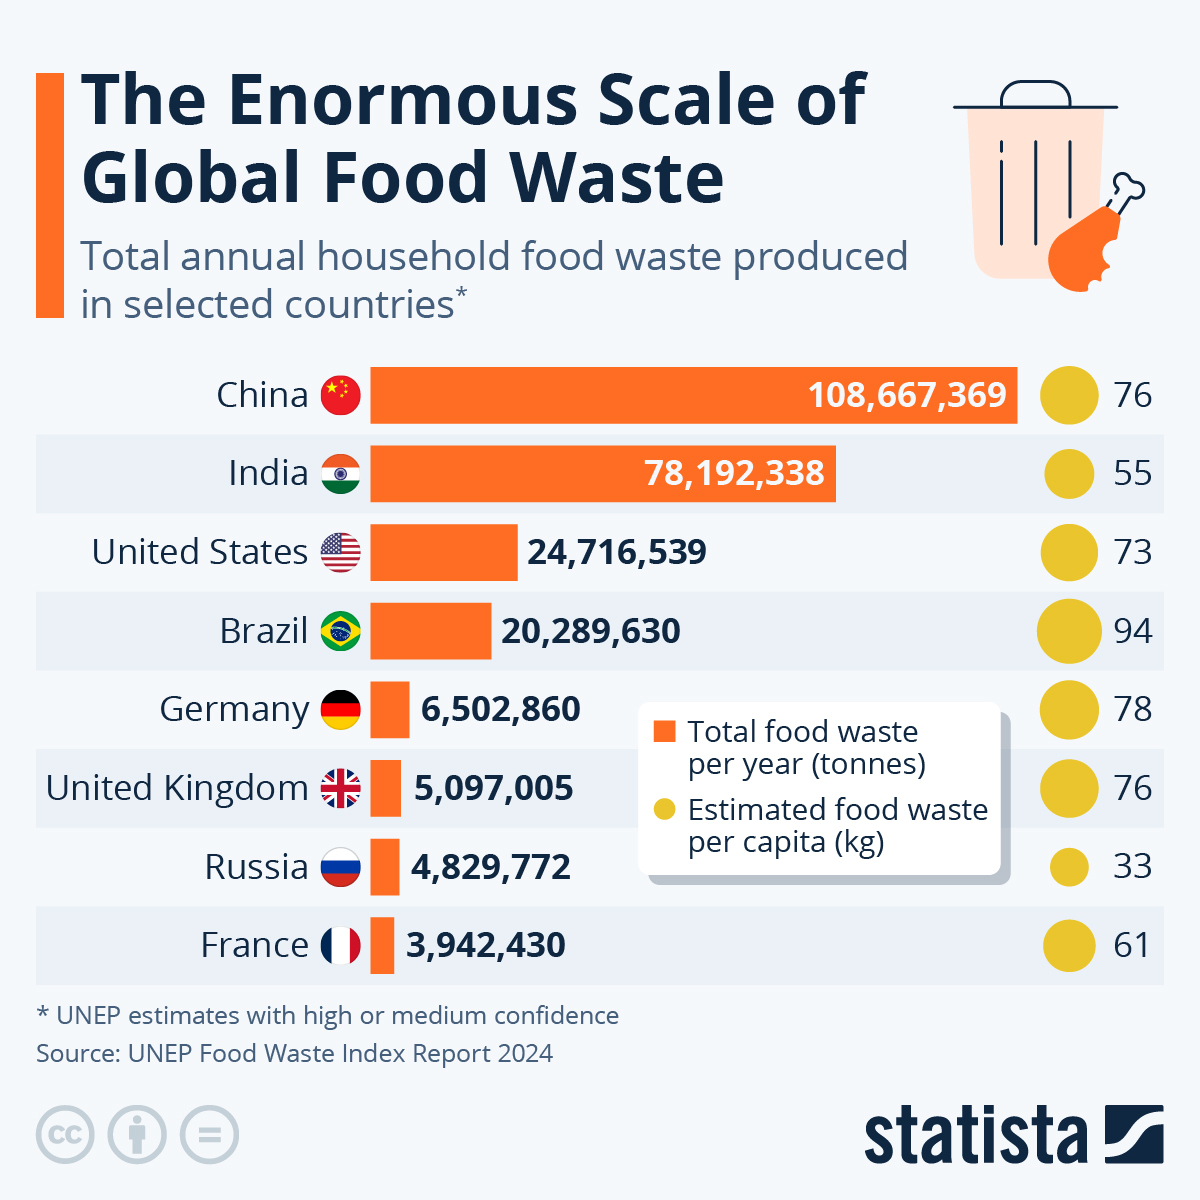
Looked at the UN report that this chart is trying to use and found this: “Food waste” is defined as food and the associated inedible parts removed from the human food supply chain.
Wait, so they’re including inedible parts like husks, peels, etc. that can’t actually be used for food? So this is more a combination of food waste and food byproducts, then. It might say more about the types of foods that these countries prefer than how wasteful there are if they consume more foods with inedible byproducts.
The motivation behind doing it was that different cultures treat what is food differently as is exemplified in their example of chicken feet. However, that also raises big questions on the efficacy of this data since houses which use raw fruits and vegetables are probably likely to have higher food waste by this definition since most people aren’t buying bone-in meat. But since a big objective of their report was tackling greenhouse gas generation from said food waste, I guess it makes sense in that context? I tried to figure out the exact methodology by which they estimate their numbers but I wasn’t able to find it.
deleted by creator
Yay finally something the US isn’t number one in.
Damn, China, give some of it to all those starving kids my parents told me about.
Data is fugly. Should be order by the per capita number , unless the intent was to mislead
Per capita with total as tiebreaker:
Brazil 94kg
Germany 78kg - 17% less than Brazil
China 76kg - 2.6% less than Germany
UK 76kg - 2.6% less than Germany
USA 73kg - 3.9% less than UK/China
France 61kg - 16% less than USA
India 55kg - 10% less than France
Russia 33kg - 40% less than India
Totally. There’s really no point in using anything /except/ per capita!
I’m a person, not capita!
Well but how many heads do you have? If you have two heads do you eat same amount as 2 persons?

